
Alert Management Framework
Alerts are automatically generated based on predefined thresholds such as high CPU usage....

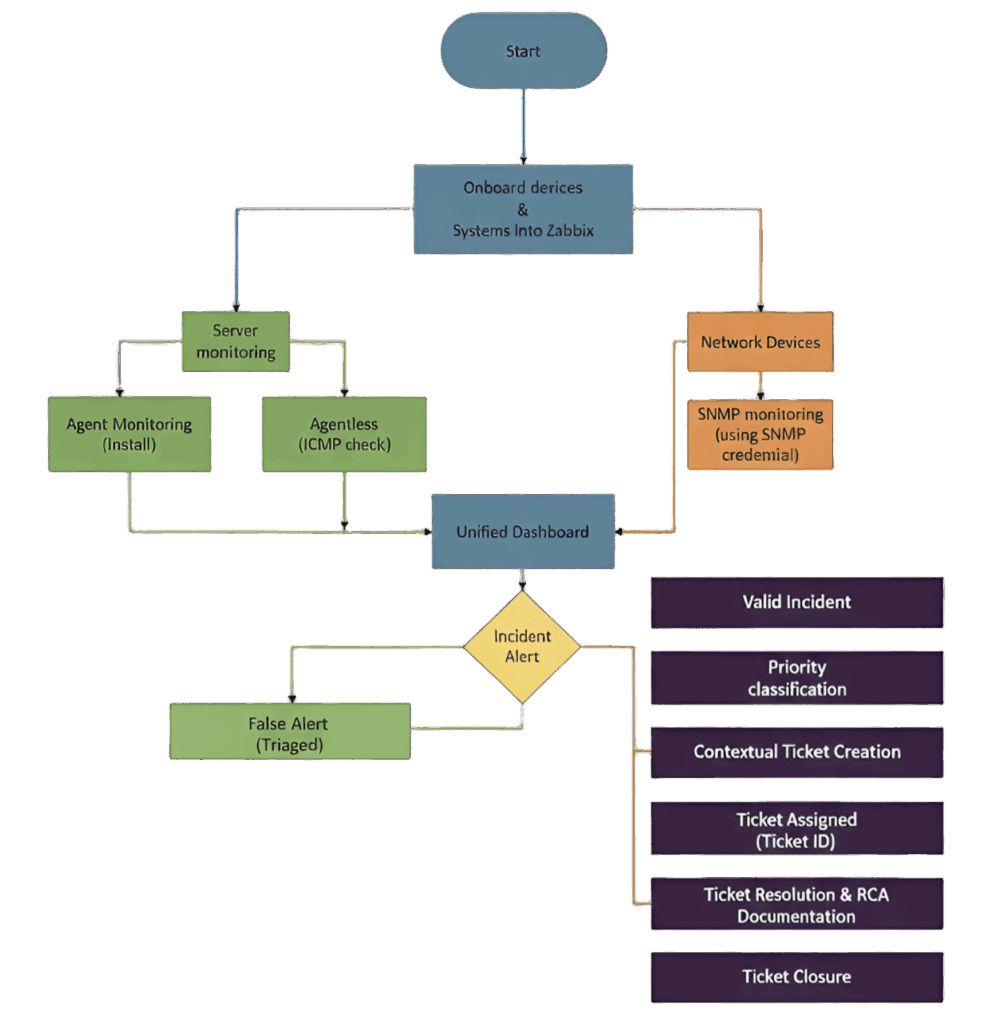
Alert to Ticket Conversion Process
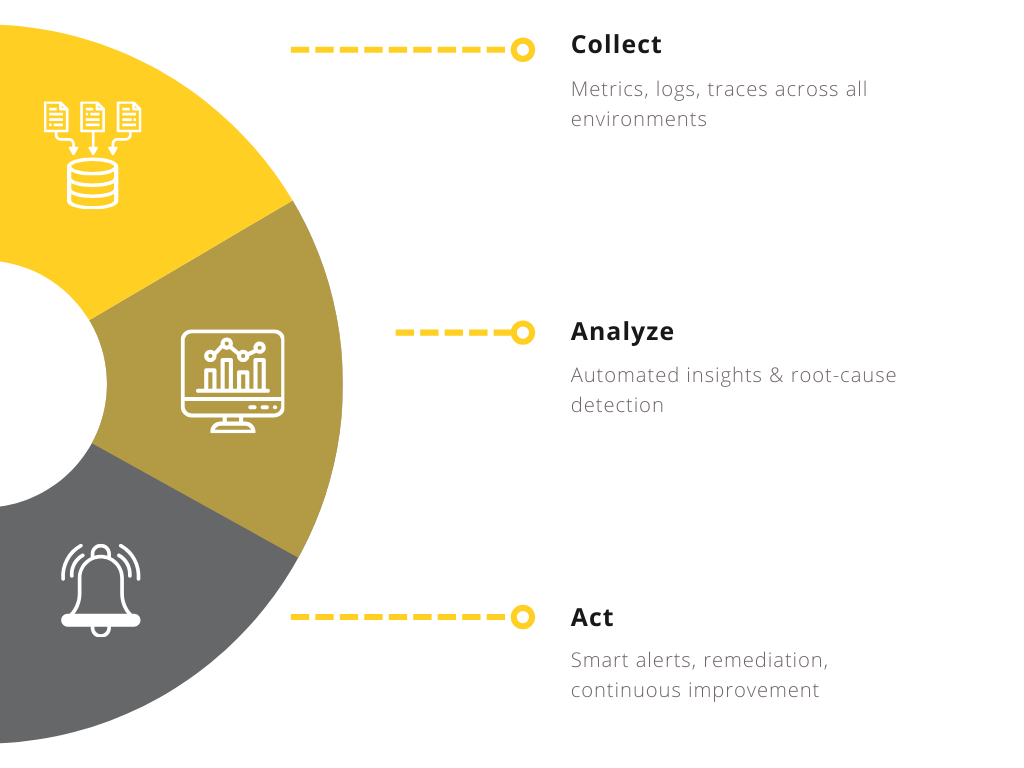
Always-on health checks, automated alerts, and ticketing.

Agent-Based Monitoring
Agent-Based Monitoring involves installing a lightweight monitoring...

Agentless Monitoring
Description: Monitoring is performed without installing any agent, using protocols like....

Centralised Dashboards
Visualize critical metrics through tailored dashboards and scheduled reports.

Network Device Monitoring (SNMP-Based)
Our network monitoring framework ensures comprehensive visibility and proactive management of all critical network infrastructure components.
Agent-Based Monitoring
Agent-Based Monitoring involves installing a lightweight monitoring agent on the server to collect real-time infrastructure, application, network, and log-level metrics for deep observability and proactive alerting.
Alert Management Framework
Alerts are automatically generated based on predefined thresholds such as high CPU usage, low disk space, server unreachable, or network interface down. Alerts are classified as Critical, High, Medium and Low severity.

Network Device Monitoring (SNMP-Based)
Our network monitoring framework ensures comprehensive visibility and proactive management of all critical network infrastructure components.
Centralised Dashboards
Our centralized dashboards provide a single-pane-of-glass view of the entire IT infrastructure, enabling unified visibility across servers, network devices, applications, and services.
Agentless Monitoring
Monitoring is performed without installing any agent, using protocols like SNMP, SSH, WMI, or ICMP. Suitable for restricted environments.
Alert to Ticket Conversion Process
Alert triggered and validated, Automated integration creates ticket, Ticket includes host details, issue description, severity, timestamp, and metrics , Assigned to responsible team , Resolution progress tracked ,Ticket closed after validation